What it answers
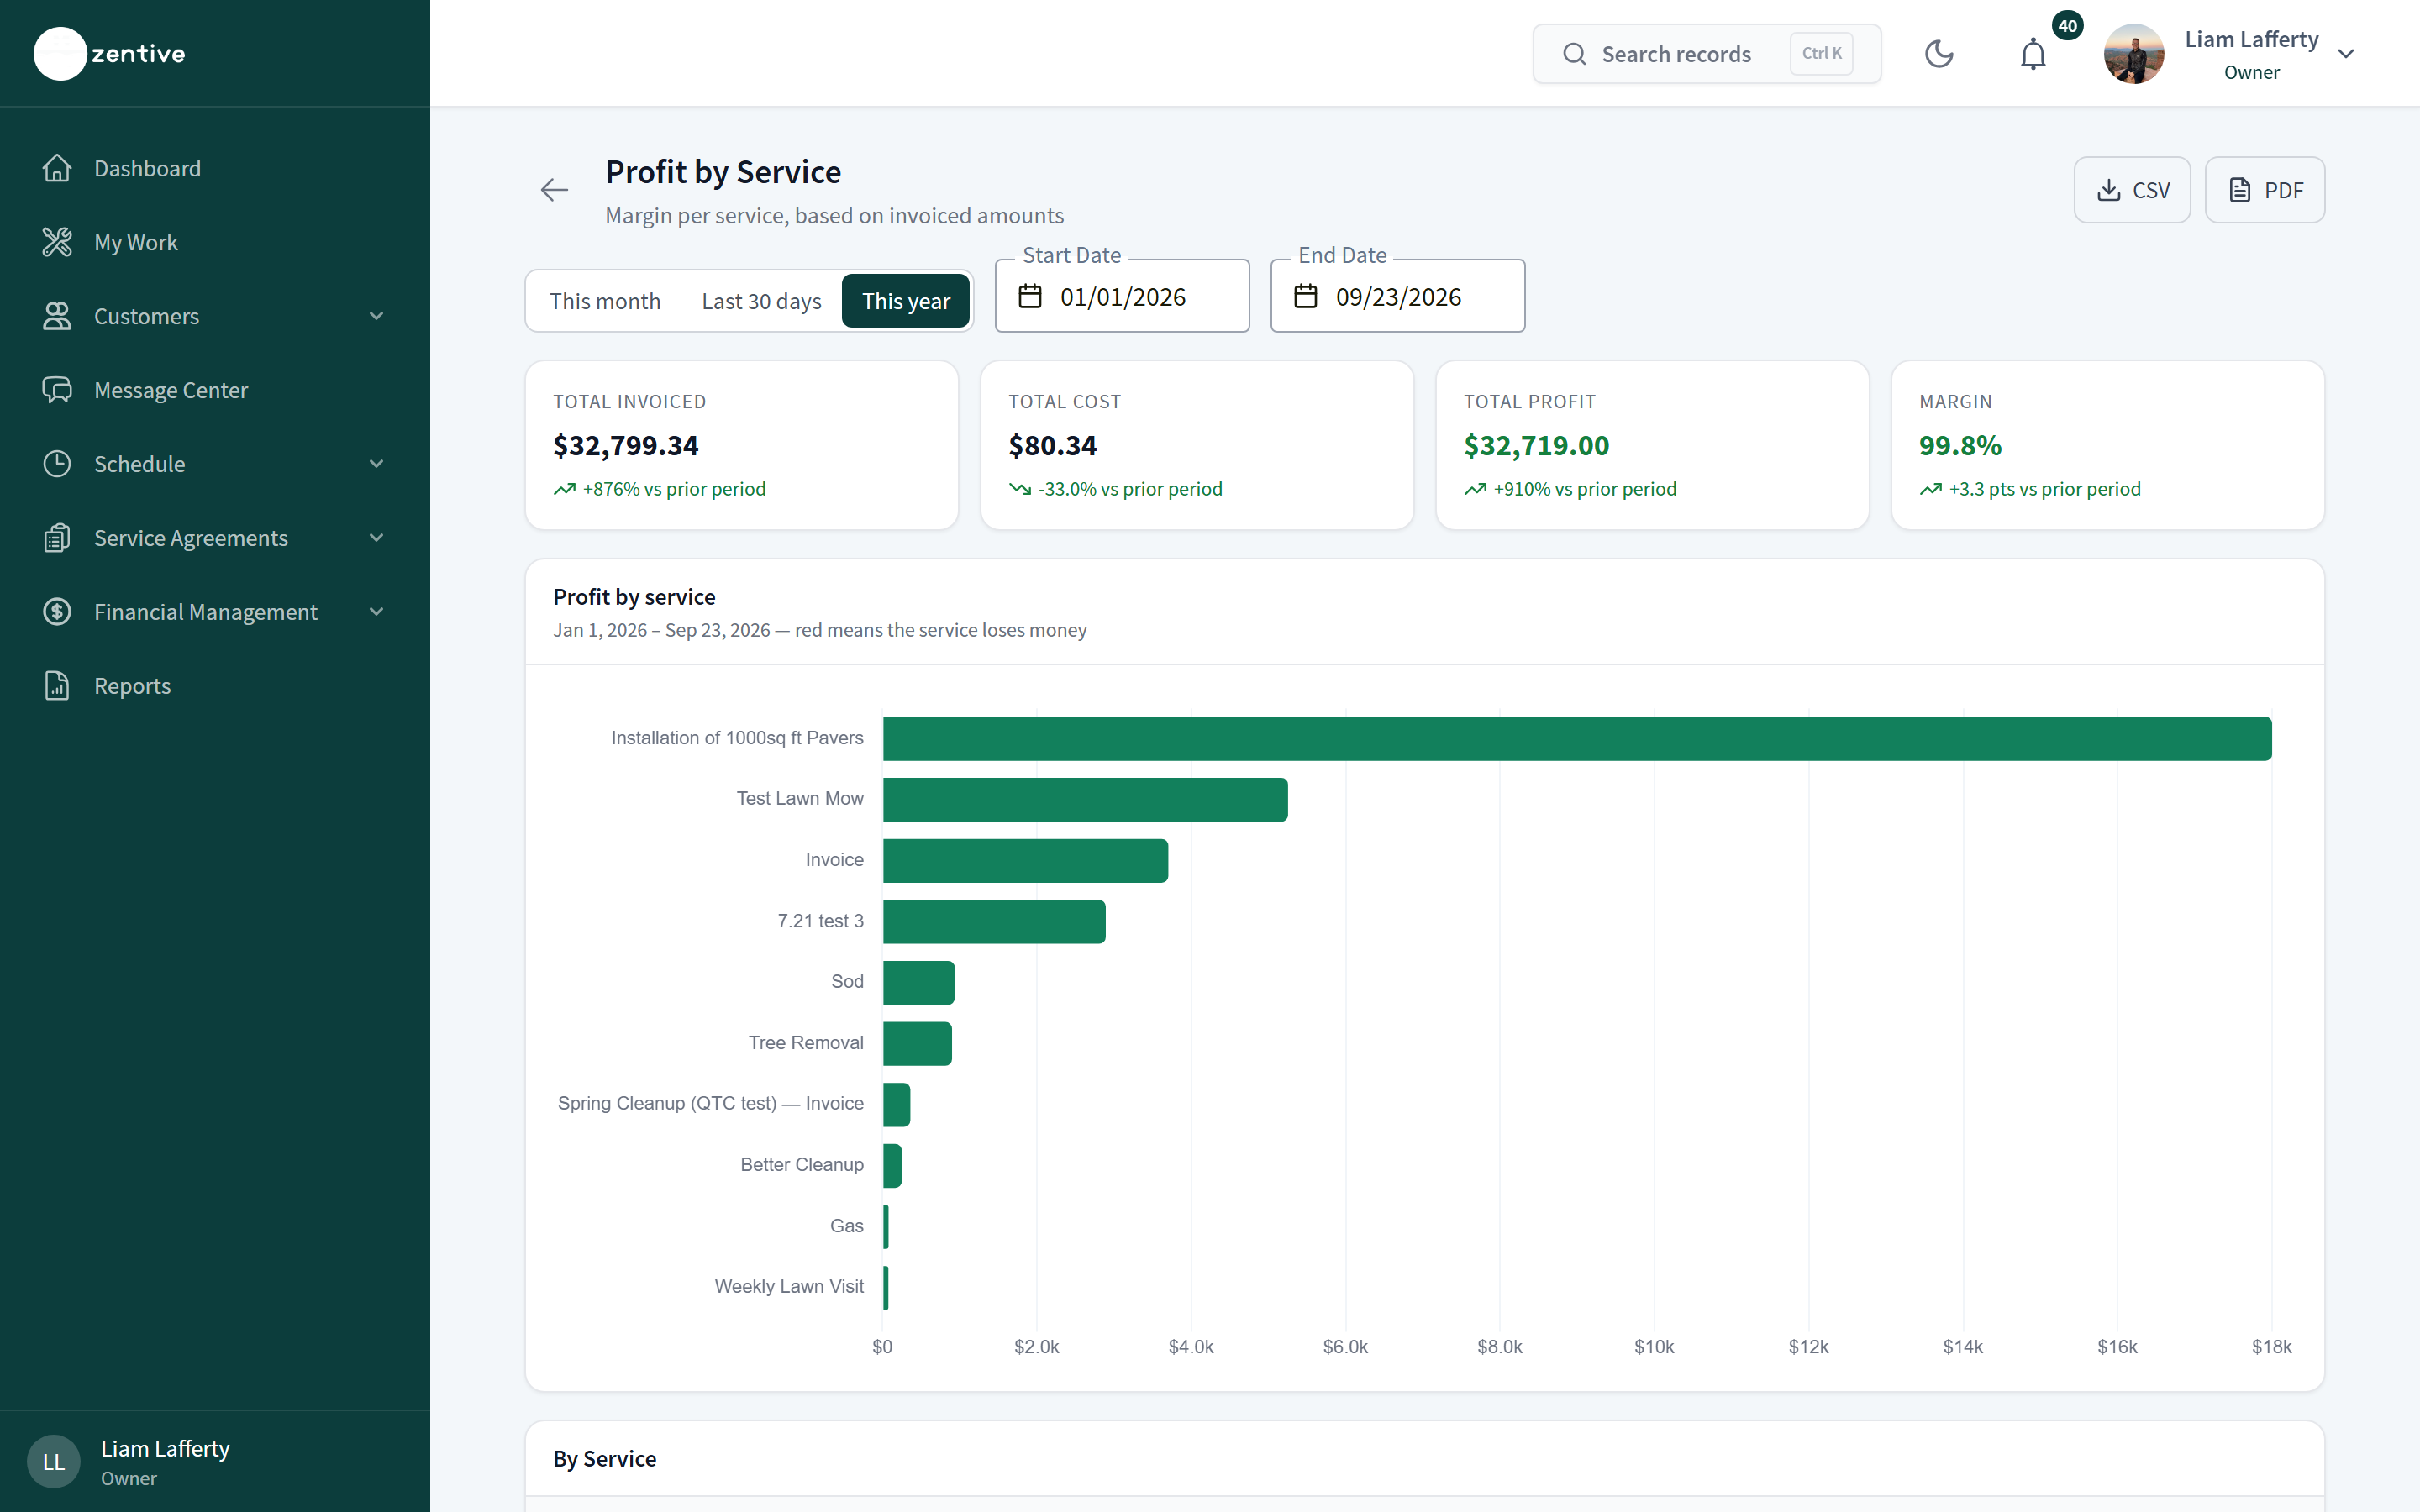
Which services make and lose the most money: revenue, cost, and margin per service item.
What's on the page
- Table per service with revenue, tracked cost (labor, materials, expenses), profit, and margin.
- Chart of margin winners and losers.
- Use it to reprice items in Settings → Products & Services.
Every report works the same way
Date presets (This month, Last 30 days, This year) or a custom Start and End date; Month / Quarter / Year grouping where it applies; stat tiles with a comparison to the prior period; charts; a table; and CSV and PDF buttons at the top right (the PDF includes the charts).
Was this helpful?
Still need help?
Contact Zentive support
Include your business name, account email, what you were trying to do, what happened instead, and a screenshot if possible. For billing, sync, or login issues, include the exact error message if shown.
Replies by emailLogin, billing, sync, and setup help
Email support